من نحن

رائد موثوق في الاستثمار والتداول العالمي

نحن راشد فوركس وسيط معرف لشركة تريدرز هوب شركة تداول مقابل الفروقات السعريه نقدم خدمات متميزة ودعم متكامل لعملائنا لتحقيق النجاح في سوق الفوركس

خدمات التداول

ناسخ صفقات

روبوت تداول

تعليم

مجموعات توصيات و تحليل الاسواق و اخبار

A hand holds a smartphone displaying a financial chart with candlestick patterns. In the background, a large, similar financial graph is visible on a screen, featuring fluctuating lines and data points.
A hand holding a smartphone displaying a stock trading chart with details on stock prices. The phone is above a wooden table where a blurred laptop screen in the background shows similar financial data. Natural light comes in from the window, creating a relaxed working environment.
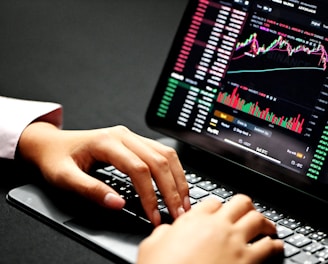
Hands typing on a laptop keyboard with a screen displaying financial graphs and stock market data. Multiple charts and numbers are visible, indicating online trading or financial analysis.
رسالتنا

قديم حلول مالية آمنة وشفافة ومخصصة، لتمكين المتداولين والمستثمرين من الوصول إلى الأسواق العالمية بثقة. من خلال الالتزام بالقيم الإماراتية، نقدم خدمة استثنائية ونبني شراكات دائمة تعزز نجاح عملائنا

A computer monitor displays a cryptocurrency exchange interface with various graphs, charts, and numerical data. On the left side, there are options for buying and selling, as well as a list of recent trades. The main graph on the right shows a price chart with a candlestick pattern, indicating fluctuations in the market over a period of time.
رؤيتنا

أن نكون الوسيط الأكثر ثقة وابتكارًا، مقدمين حلول تداول رائدة، مع وضع معايير جديدة للشفافية والتميز. من خلال الجمع بين الخبرة المحلية والفرص العالمية، نمكّن عملاءنا من تحقيق النجاح في الأسواق المالية الديناميكية